
Dear friends
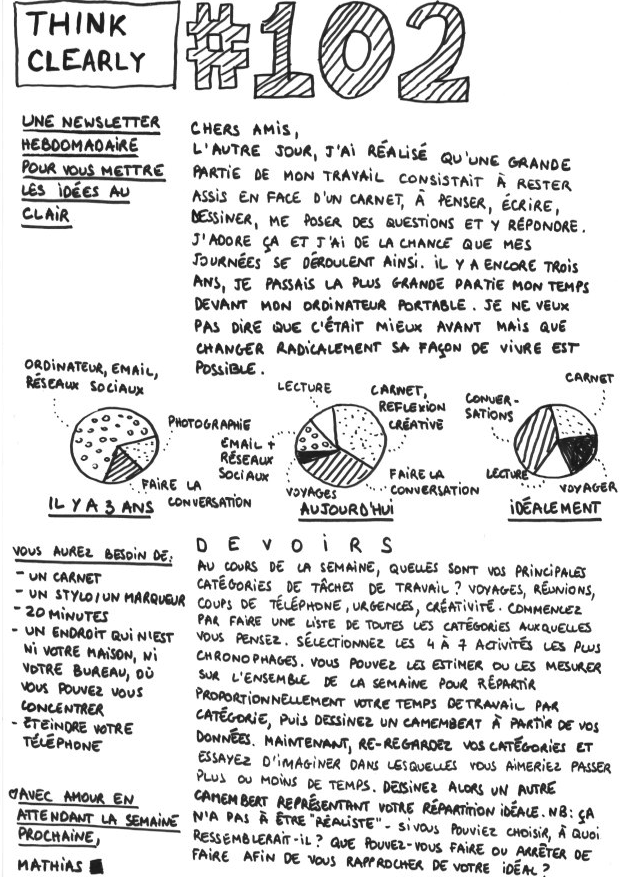
The other day I realized that a significant part of my work day is spent sitting with a notebook, thinking, writing, drawing, asking myself questions and answering. I enjoy this a lot, and I feel lucky that this is how it is. Just three years ago I spent the vast majority of my time in front of my laptop. My point is not that the former is better than the latter, but merely that it is possible to make dramatic changes in how we spend our time.
HOMEWORK
What are the main types/categories of work you do, during a week? Travel, meetings, phone calls, emergencies, creative. First make a list of all the categories you can think of. Look at the list and pick the 4-7 most time consuming. You can either estimate or measure it over a week, in order to get a proportional breakdown of how you spend your time. Draw a pie chart based on the data. Now, look again at the categories and try to feel which you would rather do more or less of. Use this to draw another pie chart that illustrates your ideal breakdown. N.B. it doesn’t have to be “realistic” – if you could, how would it be? What can you do/stop oing to get closer to the ideal?
With love until next week
Mathias

(Traduction française disponible)